Social exclusion and poverty
Income poverty has traditionally been used to measure disadvantage in society. Social exclusion is a more effective measurement because it takes into account many factors, not simply income.
The graph below shows the trends of social exclusion, for both marginal social exclusion and deep social exclusion, compared with income poverty from 2001 to 2018.
The widely used income-poverty measure in the graph is calculated not by a fixed amount of income but in relative terms, as household income below 60% of the median household income. If everyone’s income increases at the same rate, the level of income poverty stays constant.
Over the last two decades, the rate of relative income poverty among Australians has declined slightly, from 20.6% in 2001 to 17.7% in 2018. However there has been very little change since 2012.
Our social exclusion measure, by contrast, includes relative and absolute components. It reflects changes not only in income but also in unemployment, education, health and social factors which affect people’s opportunities and quality of life.
Over the same period, after falling markedly from 31% in 2001 to 22% in 2008, the rate of social exclusion rose to 25% by 2010. It has remained around that level since then, according to the latest data (2018).
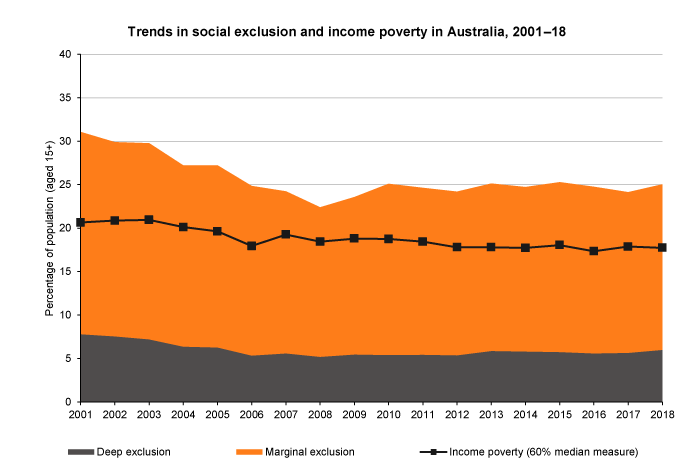
See data tables for this graph below.
Relative income poverty is an important concern and needs to be tackled. However the broader concept of social exclusion allows policy makers to consider many overlapping issues, such as unemployment, poor health and inadequate education, when trying to reduce disadvantage within the community.
Read more about measuring social exclusion
Data tables
| 2001 | 2002 | 2003 | 2004 | 2005 | 2006 | 2007 | 2008 | |
|---|---|---|---|---|---|---|---|---|
| All social exclusion | 31.1 | 29.9 | 29.8 | 27.2 | 27.2 | 24.8 | 24.2 | 22.4 |
| Marginal exclusion | 23.3 | 22.4 | 22.6 | 20.8 | 20.9 | 19.5 | 18.7 | 17.2 |
| Deep exclusion | 7.8 | 7.5 | 7.2 | 6.4 | 6.3 | 5.3 | 5.6 | 5.2 |
| Income poverty (below 60% of median income) | 20.6 | 20.9 | 20.9 | 20.1 | 19.6 | 17.9 | 18.8 | 18.7 |
| 2009 | 2010 | 2011 | 2012 | 2013 | 2014 | 2015 | 2016 | 2017 | 2018 | |
|---|---|---|---|---|---|---|---|---|---|---|
| All social exclusion | 23.6 | 25.1 | 24.6 | 24.2 | 25.1 | 24.7 | 25.3 | 24.8 | 24.1 | 25.0 |
| Marginal exclusion | 18.1 | 19.7 | 19.2 | 18.8 | 19.3 | 18.9 | 19.6 | 19.2 | 18.5 | 19.0 |
| Deep exclusion | 5.5 | 5.4 | 5.4 | 5.4 | 5.9 | 5.8 | 5.7 | 5.6 | 5.6 | 6.0 |
| Income poverty (below 60% of median income) | 18.8 | 18.7 | 18.4 | 17.8 | 17.8 | 17.7 | 18.0 | 17.3 | 17.9 | 17.7 |
Who experiences social exclusion?
See results by:
The social exclusion monitor is the work of the Brotherhood of St. Laurence and the Melbourne Institute of Applied Economic and Social Research (MIAESR). This page was updated using analysis of Wave 18 of the HILDA Survey in October 2020.