Household type
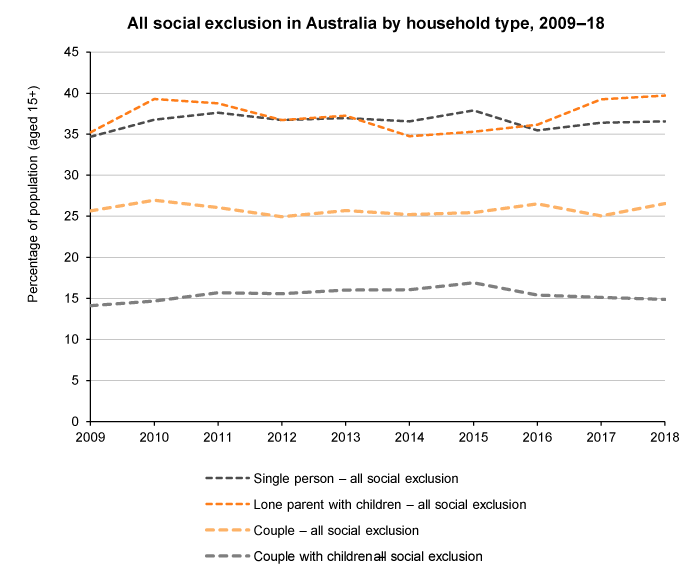
Measuring social exclusion for different types of households reveals that 40% of lone-parent households and 37% of single-person households experience social exclusion.
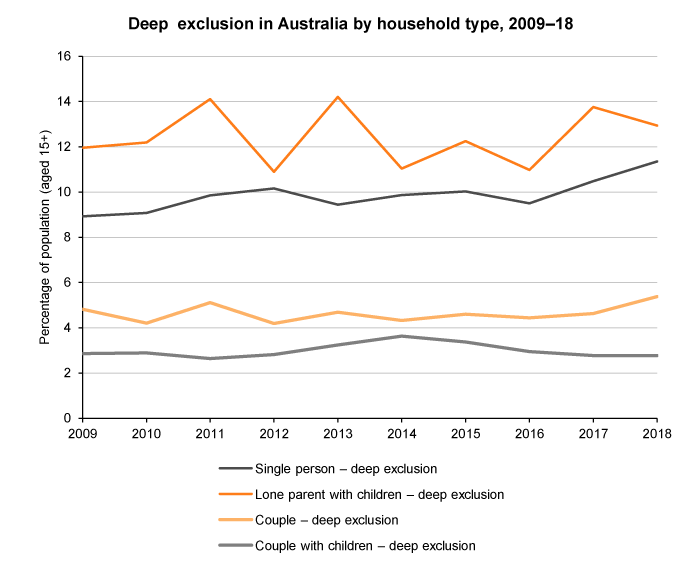
More than one in eight lone parents (13%) experience deep social exclusion based on the latest data (2018). Among people living alone, over 11% experience deep exclusion.
Compared to other types of households, couples are far less likely to experience social exclusion, especially those with dependent children (15% in 2018).
Over the period 2009 to 2018, social exclusion has increased slightly for single-person households and more for lone-parent households.
The graph immediately below shows all social exclusion, which is the total of marginal social exclusion and deep social exclusion. The second graph shows deep exclusion only.
Data table
| 2009 | 2010 | 2011 | 2012 | 2013 | 2014 | 2015 | 2016 | 2017 | 2018 | |
|---|---|---|---|---|---|---|---|---|---|---|
| All social exclusion | ||||||||||
| Couple – all social exclusion | 25.7 | 27.0 | 26.1 | 24.9 | 25.7 | 25.2 | 25.5 | 26.5 | 25.1 | 26.6 |
| Couple with children – all social exclusion | 14.1 | 14.7 | 15.7 | 15.6 | 16.0 | 16.1 | 16.9 | 15.4 | 15.1 | 14.9 |
| Lone parent with children – all social exclusion | 35.2 | 39.3 | 38.8 | 36.7 | 37.3 | 34.8 | 35.3 | 36.1 | 39.2 | 39.7 |
| Single person – all social exclusion | 34.7 | 36.8 | 37.6 | 36.7 | 37.0 | 36.6 | 37.9 | 35.4 | 36.4 | 36.6 |
| Deep exclusion | ||||||||||
| Couple – deep exclusion | 4.8 | 4.2 | 5.1 | 4.2 | 4.7 | 4.3 | 4.6 | 4.4 | 4.6 | 5.4 |
| Couple with children – deep exclusion | 2.9 | 2.9 | 2.6 | 2.8 | 3.2 | 3.6 | 3.4 | 2.9 | 2.8 | 2.8 |
| Lone parent with children – deep exclusion | 12.0 | 12.2 | 14.1 | 10.9 | 14.2 | 11.0 | 12.3 | 11.0 | 13.8 | 12.9 |
| Single person – deep exclusion | 8.9 | 9.1 | 9.8 | 10.2 | 9.4 | 9.9 | 10.0 | 9.5 | 10.5 | 11.4 |
About the social exclusion monitor
The social exclusion monitor is the work of the Brotherhood of St. Laurence and the Melbourne Institute of Applied Economic and Social Research (MIAESR). This page was updated using analysis of Wave 18 of the HILDA Survey in October 2020.