Health
Poor health and disability remain strongly linked to social exclusion in Australia.
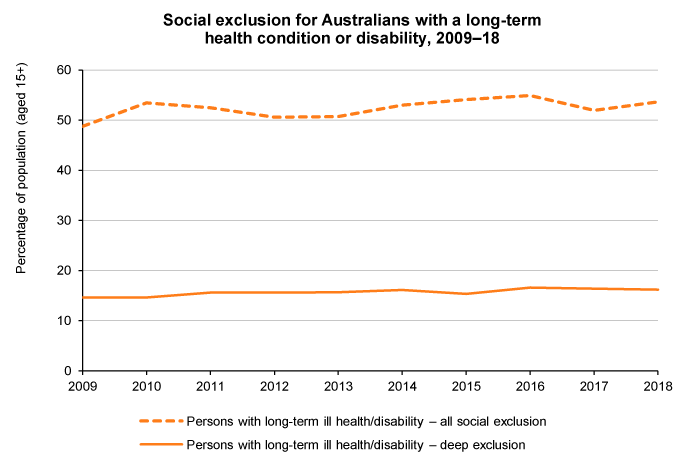
In measuring social exclusion from the latest data (2018) we found that 54% of Australians who have a long-term health condition or disability experience some level of exclusion. Over 16% experience deep social exclusion.
Since 2010, the rate of social exclusion in this group has fluctuated, but remained above 50%. This is twice the rate for all Australians in 2018.
In the graph below, the ‘all social exclusion’ line shows the total of marginal social exclusion and deep social exclusion.
Data table
| 2009 | 2010 | 2011 | 2012 | 2013 | 2014 | 2015 | 2016 | 2017 | 2018 | |
|---|---|---|---|---|---|---|---|---|---|---|
| All social exclusion | ||||||||||
| Persons with long-term ill health/disability – all social exclusion | 48.8 | 53.4 | 52.5 | 50.6 | 50.7 | 53.0 | 54.1 | 54.9 | 52.0 | 53.7 |
| Deep exclusion | 14.7 | 14.7 | 15.6 | 15.6 | 15.7 | 16.1 | 15.4 | 16.6 | 16.4 | 16.2 |
About the social exclusion monitor
The social exclusion monitor is the work of the Brotherhood of St. Laurence and the Melbourne Institute of Applied Economic and Social Research (MIAESR). This page was updated using analysis of Wave 18 of the HILDA Survey in October 2020.