Indigenous background
In measuring social exclusion using the latest data (2018) we found that 47% of Indigenous Australians experience social exclusion, compared with 25% of all Australians.
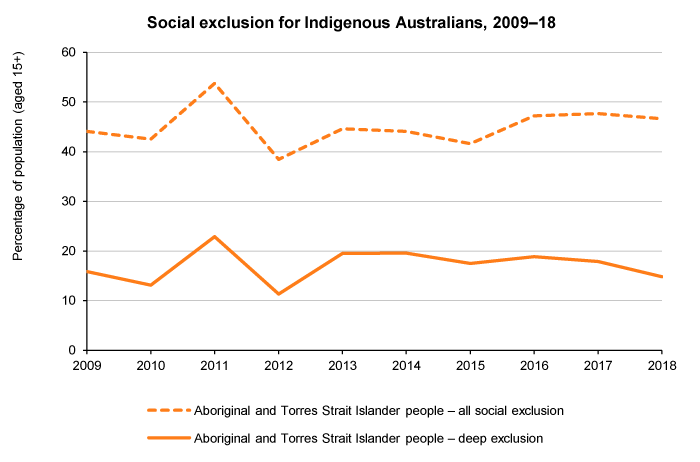
In 2018, 15% of Indigenous Australians experience deep social exclusion.
Over the period 2009 to 2018, social exclusion among Indigenous Australians increased, peaking at 54% in 2011. It has remained above 40% since 2013.
It is important to note that the data source for the social exclusion monitor, the Household, Income and Labour Dynamics in Australia (HILDA) Survey, does not include people living in sparsely populated or remote areas.
In the graph below, the ‘all social exclusion’ line shows the total of marginal social exclusion and deep social exclusion.
Data table
<
| 2009 | 2010 | 2011 | 2012 | 2013 | 2014 | 2015 | 2016 | 2017 | 2018 | |
|---|---|---|---|---|---|---|---|---|---|---|
| All social exclusion | ||||||||||
| All Australians – all social exclusion | 23.6 | 25.1 | 24.6 | 24.2 | 25.1 | 24.7 | 25.3 | 24.8 | 24.1 | 25.0 |
| Aboriginal and Torres Strait Islander – all social exclusion | 44.1 | 42.5 | 53.8 | 38.5 | 44.6 | 44.1 | 41.6 | 47.2 | 47.7 | 46.6 |
| Other Australians– all social exclusion | 21.5 | 22.8 | 22.5 | 22.5 | 22.9 | 23.2 | 23.7 | 23.6 | 22.8 | 24.0 |
| Deep exclusion | ||||||||||
| All Australians – deep exclusion | 5.5 | 5.4 | 5.4 | 5.4 | 5.9 | 5.8 | 5.7 | 5.6 | 5.6 | 6.0 |
| Aboriginal and Torres Strait Islander – deep exclusion | 15.8 | 13.1 | 22.9 | 11.3 | 19.5 | 19.5 | 17.5 | 18.9 | 17.9 | 14.8 |
| Other Australians– deep exclusion | 4.8 | 4.6 | 4.9 | 5.2 | 5.2 | 5.4 | 5.4 | 5.3 | 5.5 | 5.8 |
About the social exclusion monitor
The social exclusion monitor is the work of the Brotherhood of St. Laurence and the Melbourne Institute of Applied Economic and Social Research (MIAESR). This page was updated using analysis of Wave 18 of the HILDA Survey in October 2020.