Education
Inadequate education and skills are strongly linked to social exclusion in Australia.
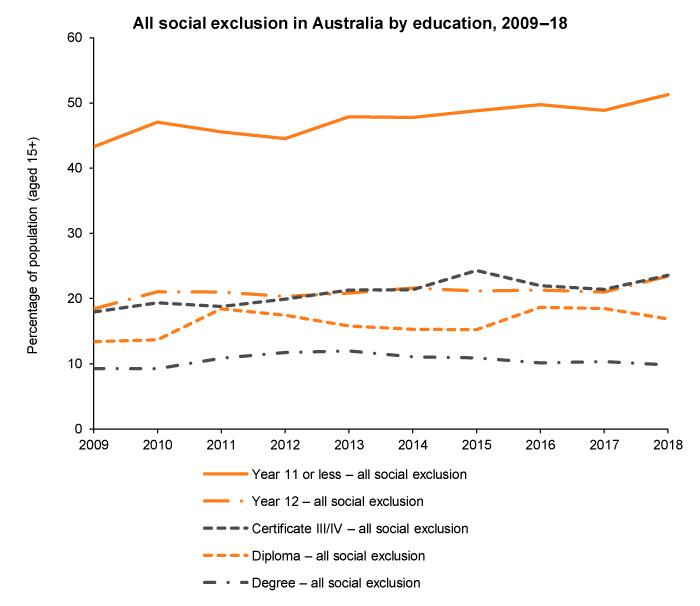
In measuring social exclusion using the latest dat (2018) we found that early school leavers, those with Year 11 or below, continue to experience social exclusion at more than twice the rate of those who complete Year 12 – 51% compared with 23% – and three times the rate of those with a diploma or a degree.
Among Australians with Year 11 education or below, social exclusion has increased from 43% in 2009 to 51% in 2018.
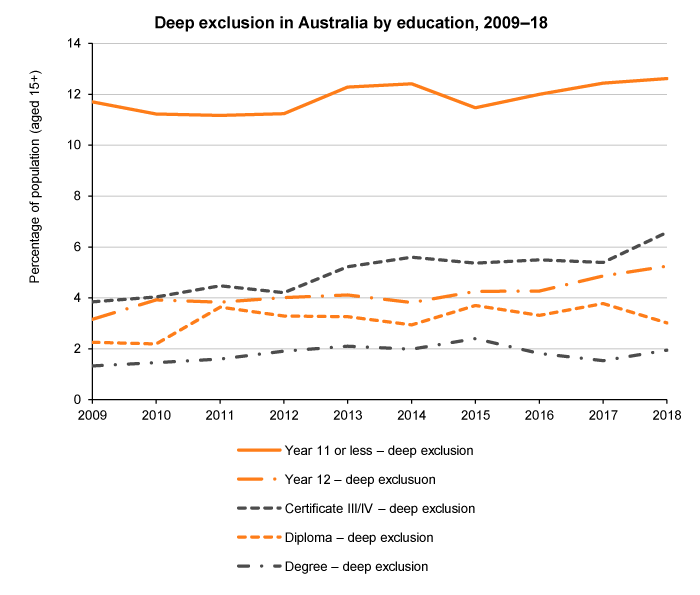
As well, in 2018 almost 13% of these early school leavers experience deep social exclusion, compared to 5% of those who have completed Year 12.
In the graph below, ‘all social exclusion’ refers to the total of marginal social exclusion and deep social exclusion. The second graph shows deep exclusion only.
Data table
| 2009 | 2010 | 2011 | 2012 | 2013 | 2014 | 2015 | 2016 | 2017 | 2018 | |
|---|---|---|---|---|---|---|---|---|---|---|
| All social exclusion | ||||||||||
| Degree – all social exclusion | 9.3 | 9.2 | 10.9 | 11.7 | 12.0 | 11.1 | 10.9 | 10.1 | 10.4 | 9.8 |
| Diploma – all social exclusion | 13.4 | 13.7 | 18.5 | 17.4 | 15.8 | 15.3 | 15.2 | 18.7 | 18.5 | 16.9 |
| Certificate III/IV – all social exclusion | 17.9 | 19.4 | 18.8 | 19.9 | 21.3 | 21.4 | 24.3 | 22.0 | 21.4 | 23.6 |
| Year 12 – all social exclusion | 18.4 | 21.0 | 21.0 | 20.3 | 20.8 | 21.6 | 21.2 | 21.3 | 21.0 | 23.4 |
| Year 11 or less – all social exclusion | 43.3 | 47.1 | 45.6 | 44.5 | 47.9 | 47.8 | 48.8 | 49.7 | 48.8 | 51.3 |
| Deep exclusion | ||||||||||
| Degree – deep exclusion | 1.3 | 1.5 | 1.6 | 1.9 | 2.1 | 2.0 | 2.4 | 1.8 | 1.5 | 1.9 |
| Diploma – deep exclusion | 2.3 | 2.2 | 3.6 | 3.3 | 3.3 | 2.9 | 3.7 | 3.3 | 3.8 | 3.0 |
| Certificate III/IV – deep exclusion | 3.8 | 4.0 | 4.5 | 4.2 | 5.2 | 5.6 | 5.4 | 5.5 | 5.4 | 6.6 |
| Year 12 – deep exclusuon | 3.2 | 3.9 | 3.8 | 4.0 | 4.1 | 3.8 | 4.3 | 4.3 | 4.9 | 5.2 |
| Year 11 or less – deep exclusion | 11.7 | 11.2 | 11.2 | 11.2 | 12.3 | 12.4 | 11.5 | 12.0 | 12.4 | 12.6 |
About the social exclusion monitor
The social exclusion monitor is the work of the Brotherhood of St. Laurence and the Melbourne Institute of Applied Economic and Social Research (MIAESR). This page was updated using analysis of Wave 18 of the HILDA Survey in October 2020.