Gender
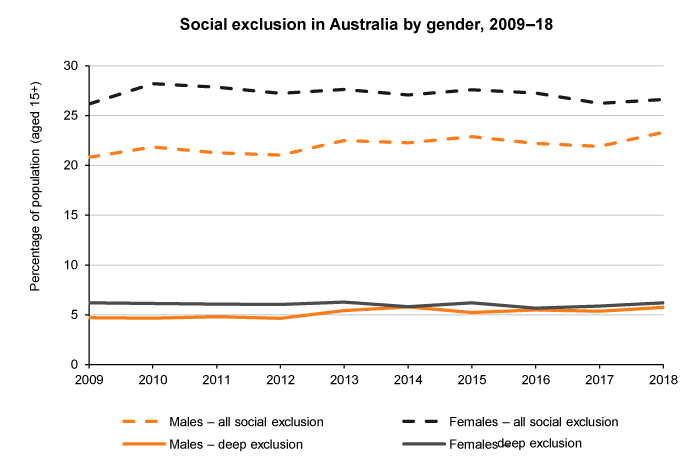
In measuring social exclusion we found that more women than men are socially excluded each year – 27% compared to 23% for men in 2018.
When it comes to deep social exclusion, the gap is narrower. Some 6.2% of women are deeply excluded, compared with 5.7% of men in 2018.
Over the period 2009–18, social exclusion has worsened for men, while remaining fairly steady (but higher) for women.
In the graph below the ‘all social exclusion’ lines show the total of marginal social exclusion and deep social exclusion.
Data table
| 2009 | 2010 | 2011 | 2012 | 2013 | 2014 | 2015 | 2016 | 2017 | 2018 | |
|---|---|---|---|---|---|---|---|---|---|---|
| All social exclusion | ||||||||||
| Males – all social exclusion | 20.8 | 21.9 | 21.3 | 21.0 | 22.5 | 22.3 | 22.9 | 22.2 | 21.9 | 23.3 |
| Females – all social exclusion | 26.2 | 28.2 | 27.9 | 27.2 | 27.6 | 27.1 | 27.6 | 27.3 | 26.2 | 26.6 |
| Deep exclusion | ||||||||||
| Males – deep exclusion | 4.7 | 4.7 | 4.8 | 4.7 | 5.4 | 5.8 | 5.2 | 5.5 | 5.4 | 5.7 |
| Females – deep exclusion | 6.2 | 6.1 | 6.1 | 6.0 | 6.3 | 5.8 | 6.2 | 5.7 | 5.9 | 6.2 |
About the social exclusion monitor
The social exclusion monitor is the work of the Brotherhood of St. Laurence and the Melbourne Institute of Applied Economic and Social Research (MIAESR). This page was updated using analysis of Wave 18 of the HILDA Survey in October 2020.