Housing
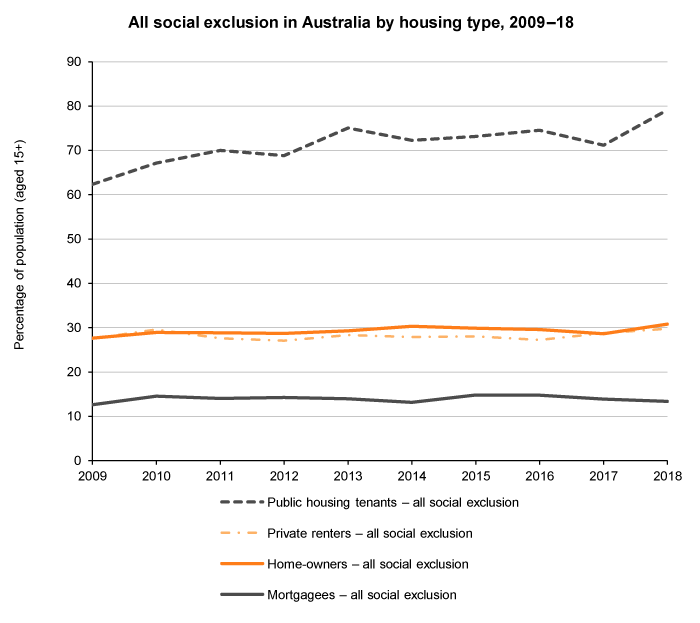
In measuring social exclusion using the latest data (2018), we found that 79% of public housing tenants are socially excluded. More than one in four Australians (27%) living in public housing experience deep social exclusion.
These findings do not imply that public housing causes social exclusion. With public housing insufficient to meet demand, the priority for accommodation is the people with the greatest need.
Among private renters, 30% are socially excluded in 2018, with 9% experiencing deep exclusion. This poses questions for government about how social policies affect disadvantaged people who are living in private rental housing.
On the positive side, home owners with mortgages have a lower rate of social exclusion (13%) than people in other housing situations.
Over the 2009–18 period, social exclusion remained steady for people in most housing situations. However, the percentage of public housing tenants experiencing social exclusion grew markedly from 62% in 2009 to 79% in 2018.
The graph immediately below shows all social exclusion, which is the total of marginal social exclusion and deep social exclusion. The second graph shows deep exclusion only.
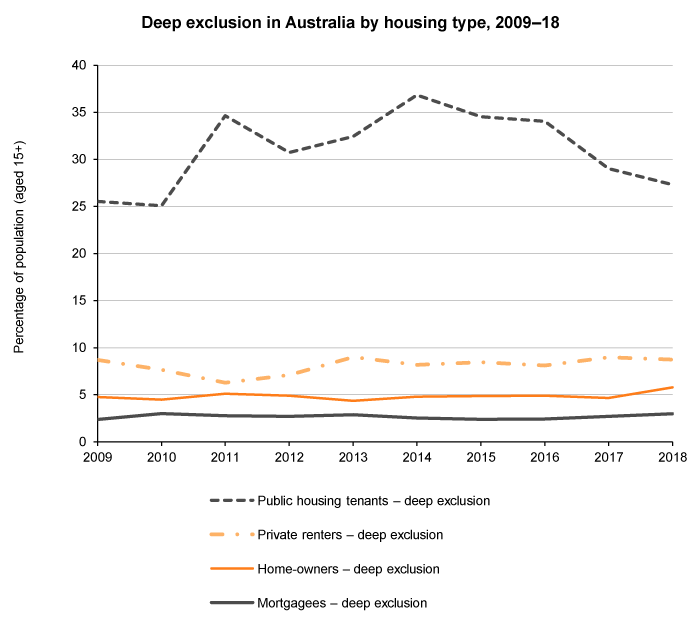
Data table
| 2009 | 2010 | 2011 | 2012 | 2013 | 2014 | 2015 | 2016 | 2017 | 2018 | |
|---|---|---|---|---|---|---|---|---|---|---|
| All social exclusion | ||||||||||
| Home-owners – all social exclusion | 27.6 | 28.9 | 28.9 | 28.7 | 29.3 | 30.3 | 29.9 | 29.6 | 28.6 | 30.8 |
| Mortgagees – all social exclusion | 12.6 | 14.5 | 14.0 | 14.2 | 14.0 | 13.2 | 14.8 | 14.8 | 13.9 | 13.4 |
| Private renters – all social exclusion | 27.6 | 29.6 | 27.6 | 27.1 | 28.4 | 27.9 | 28.1 | 27.2 | 28.8 | 29.8 |
| Public housing tenants – all social exclusion | 62.4 | 67.2 | 70.0 | 68.8 | 75.0 | 72.3 | 73.1 | 74.5 | 71.2 | 79.1 |
| Deep exclusion | ||||||||||
| Home-owners – deep exclusion | 4.8 | 4.5 | 5.1 | 4.9 | 4.4 | 4.8 | 4.9 | 4.9 | 4.7 | 5.8 |
| Mortgagees – deep exclusion | 2.4 | 3.0 | 2.8 | 2.7 | 2.9 | 2.5 | 2.4 | 2.4 | 2.7 | 3.0 |
| Private renters – deep exclusion | 8.7 | 7.7 | 6.3 | 7.1 | 9.0 | 8.2 | 8.5 | 8.1 | 9.0 | 8.7 |
| Public housing tenants – deep exclusion | 25.6 | 25.1 | 34.6 | 30.7 | 32.4 | 36.8 | 34.5 | 34.0 | 29.0 | 27.3 |
About the social exclusion monitor
The social exclusion monitor is the work of the Brotherhood of St. Laurence and the Melbourne Institute of Applied Economic and Social Research (MIAESR). This page was updated using analysis of Wave 18 of the HILDA Survey in October 2020.