Our social exclusion measure
Income alone has often been used to measure disadvantage in Australia. Our measure of social exclusion goes further to capture many overlapping factors that may exclude a person from participating fully in social and economic life.
How we measure social exclusion
The Brotherhood of St. Laurence began collaborating with the Melbourne Institute of Applied Economic and Social Research (MIAESR) in 2008 to find out who experiences social exclusion.
For this work, we focused on seven key areas or ‘domains’ of life: material resources, employment, education and skills, health and disability, social connection, community and personal safety. Across these life domains, we selected 30 key components of disadvantage that are measurable. These are called indicators of social exclusion. Using these indicators we created a composite measure that allows us to measure an individual’s overall level of exclusion.
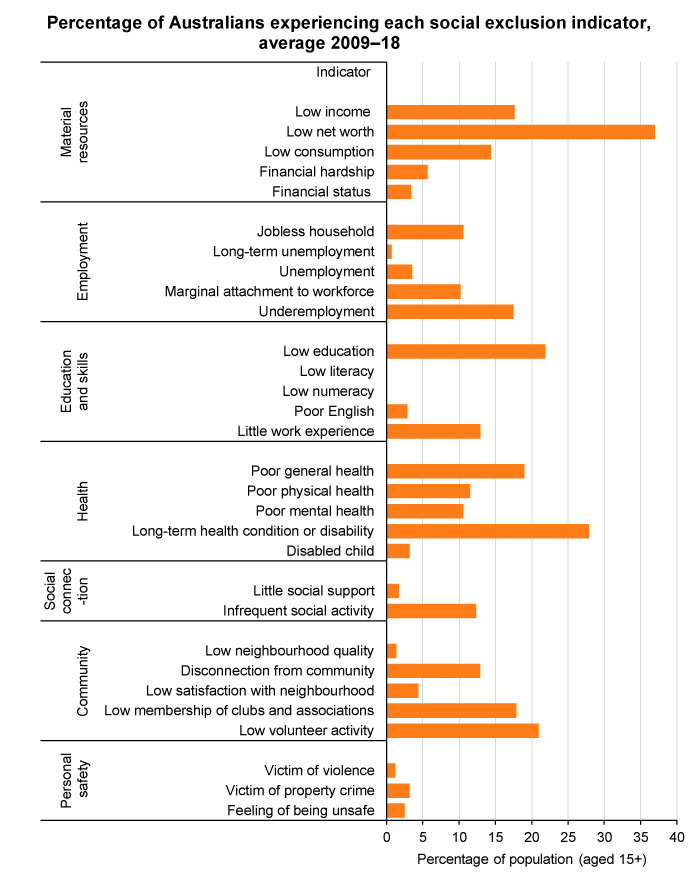
See data table for this graph below.
Marginal and deep social exclusion
We classify exclusion into marginal social exclusion and deep social exclusion. For example, an individual counted as deeply excluded will most likely be experiencing at least four of the indicators across at least two domains.
Read more about the depth of social exclusion .
The data we analyse
The data we use is from the Household, Income and Labour Dynamics in Australia (HILDA) Survey. This is a nationally representative study of Australian households that began in 2001 (see www.melbourneinstitute.com/hilda/ ). The study aims to follow the same group of more than 13,000 people, aged over 15 years, who are interviewed each year about a wide range of social and economic aspects of life.
Using an annual survey like HILDA allows us to analyse changes in individual and household social exclusion over time to assess trends. We can then examine the prevalence of exclusion, its depth and persistence – and work out who experiences it. The monitor is updated with each new wave of the HILDA survey. The latest data is from Wave 18, collected in 2018.
Although it includes a wide range of data, the HILDA Survey has a few limitations. It does not collect data on homelessness, internet access, lifelong learning, voter enrolment and experiences of discrimination so these issues are not included in our key indicators.
Find out more about measuring social exclusion
Scutella, R, Wilkins, R & Horn, M 2009, Measuring poverty and social exclusion in Australia: a proposed multi-dimensional framework for identifying socio-economic disadvantage , Melbourne Institute Working Paper no. 4/09 (PDF, 494 KB)
Rosanna Scutella, Roger Wilkins and Weiping Kostenko 2009, Estimates of poverty and social exclusion in Australia: a multi-dimensional approach, Melbourne Institute Working Paper no. 26/09 (PDF, 1.2 MB)
Data table
| Average 2009–18 | |
|---|---|
| Employment | |
| Low income | 17.6 |
| Low net worth | 37.0 |
| Low consumption | 14.3 |
| Financial hardship | 5.7 |
| Financial status | 3.4 |
| Employment | |
| Jobless household | 10.6 |
| Long-term unemployment | 0.7 |
| Unemployment | 3.5 |
| Marginal attachment to workforce | 10.2 |
| Underemployment | 17.5 |
| Education and skills | |
| Low education | 21.9 |
| Low literacy | --- |
| Low numeracy | --- |
| Poor English | 2.9 |
| Little work experience | 12.9 |
| Health | |
| Poor general health | 19.0 |
| Poor physical health | 11.5 |
| Poor mental health | 10.6 |
| Long-term health condition or disability | 27.9 |
| Disabled child | 3.2 |
| Social connection | |
| Little social support | 1.7 |
| Infrequent social activity | 12.4 |
| Community | |
| Low neighbourhood quality | 1.4 |
| Disconnection from community | 12.9 |
| Low satisfaction with neighbourhood | 4.4 |
| Low membership of clubs and associations | 17.9 |
| Low volunteer activity | 20.9 |
| Personal safety | |
| Victim of violence | 1.2 |
| Victim of property crime | 3.2 |
| Feeling of being unsafe | 2.5 |
The social exclusion monitor is the work of the Brotherhood of St. Laurence and the Melbourne Institute of Applied Economic and Social Research (MIAESR). This page was updated using analysis of Wave 18 of the HILDA Survey in October 2020.