Depth of social exclusion
Our measure of social exclusion is based on a combined score, which is determined by giving weightings to each of the 30 indicators we used – such as low income, unemployment, poor English and poor physical health.
Scores on our scale range from less than 1 to more than 3.
Three-quarters of Australians score less than 1 (using the latest data, from 2018). People who score above a total of 1 on our scale are considered to be experiencing some level of exclusion.
People’s experiences of social exclusion can then be divided into three levels: marginal exclusion, deep exclusion and very deep exclusion.
Marginal social exclusion
People scoring 1–2 on our scale are considered to be experiencing marginal social exclusion.
In 2009, 18% of Australians were marginally excluded (down from 23% in 2001). Since 2009, there has been little change in the rate of marginal exclusion, with 19% of Australians experiencing this level of exclusion in 2018.
Deep social exclusion
People scoring 2 or more on our scale are considered to be experiencing deep social exclusion.
In 2009, 5% of Australians were experiencing deep exclusion (down from 7.8% in 2001). Over ten years the rate of deep exclusion has risen slightly to 6% in 2018. This means that more than 1.2 million Australians still experience deep social exclusion.
Very deep social exclusion
People scoring 3 or more on our scale are considered to be experiencing very deep social exclusion. (They are part of the larger group who are deeply excluded.)
In 2009, 1% of Australians were very deeply excluded. By 2018, this figure rose slightly to 1.3%, which means that more than 260,000 Australians experience very deep social exclusion each year.
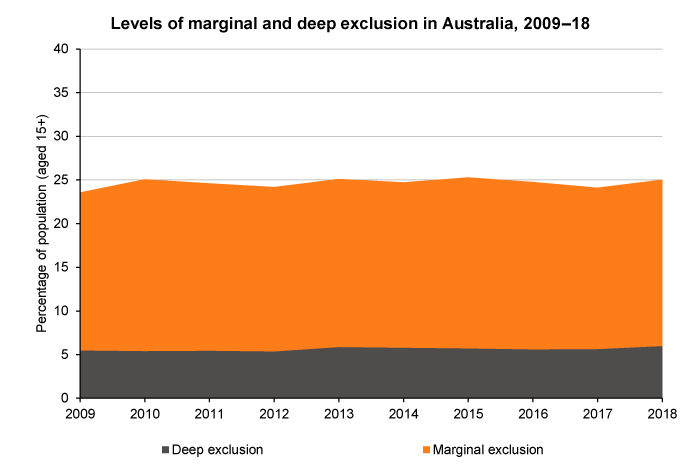
See data table for this graph below.
Find out more about measuring social exclusion
Data table
<
| 2009 | 2010 | 2011 | 2012 | 2013 | 2014 | 2015 | 2016 | 2017 | 2018 | |
|---|---|---|---|---|---|---|---|---|---|---|
| All social exclusion | 23.6 | 25.1 | 24.6 | 24.2 | 25.1 | 24.7 | 25.3 | 24.8 | 24.1 | 25.0 |
| Marginal exclusion | 18.1 | 19.7 | 19.2 | 18.8 | 19.3 | 18.9 | 19.6 | 19.2 | 18.5 | 19.0 |
| Deep exclusion | 5.5 | 5.4 | 5.4 | 5.4 | 5.9 | 5.8 | 5.7 | 5.6 | 5.6 | 6.0 |
Who experiences social exclusion?
See results by:
The social exclusion monitor is the work of the Brotherhood of St. Laurence and the Melbourne Institute of Applied Economic and Social Research (MIAESR). This page was updated using analysis of Wave 18 of the HILDA Survey in October 2020.